

Having performance issues with an Android app? If its UI is built with Jetpack Compose, this article might help
Your brand new app gets bombarded with user complaints on Google Play about it hanging or slowing down? Follow the tips in this article to fix it.
Hello! My name is Sergey Panov, and I am a mobile developer at IceRock. Today, I will be using our Campus app as an example to demonstrate profiling and optimization techniques for Jetpack Compose.
Campus is an app that allows students to view their class schedule. Its main feature is the schedule screen consisting of two pagers for weeks and days. When users tried to swipe them, it caused the app to hang, but we managed to fix it.
Here are the topics discussed in the article:
- Recomposition Counts. Pinpointing Excessive Recompositions.
- Compose Compiler Metrics. Identifying the Root Causes of Excessive Recompositions.
- CPU Profiling. Finding "Hot" Methods and Freeing up the CPU.
- GPU Profiling. Learning Which Components Take a Long Time to Draw.
- More Tips on Fixing Bugs Identified with Profiling Tool.
Recomposition Counts. Pinpointing Excessive Recompositions
Issue. The first concept we need to highlight is that of recomposition.
Rendering a screen in Compose consists of traversing the graph of composable functions. If a graph node changes its state (i.e. arguments of a composable method, values of MutableState or animations change), the subgraph is updated, that is, the functions are called again. Such an update is called a recomposition.
Recompositions are fast and should not present any issues, but frequent recompositions can cause an app to slow down.
This is a distinctive feature and a pitfall of Compose. After all, a developer can make some mistakes leading to excessive recompositions, for instance, recreate an object instead of reusing it. This results in unnecessary computations and performance issues.
Solution. In large projects, these mistakes might be tricky to detect by the unaided eye, so Android Studio provides our eyes with an aid---a tool called Recomposition Counts.
It can be enabled in Layout Inspector to see how often a composable function is called or skipped. Follow this guide to display these stats.
Application. Let’s use Campus as an example to check whether we have any excessive recompositions. We run the project in the emulator and navigate to Layout Inspector. After we’ve enabled Recomposition Counts, two new columns appear that show the number of recompositions and skips for each composable method. Now we can see that, with each swipe to the next day, ScheduleDayPage and RemoteStateContent methods are recomposed three times instead of one and don’t get skipped at all.
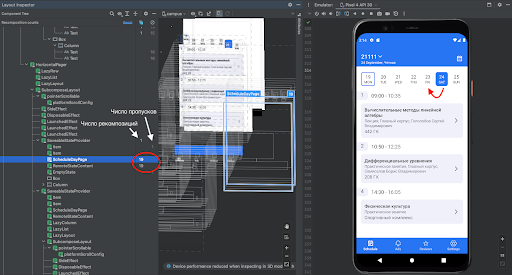

This means that we have managed to pinpoint the issue and identify the method that requires a closer look:
@Composable
fun ScheduleDayPage(
   state: RemoteState<ScheduleDay>,
   onItemClick: (ScheduleDetails) -> Unit,
   viewAds: (ScheduleDay.Lesson) -> Unit,
   clickOnAds: (ScheduleDay.Lesson) -> Unit
) {
   ...
}
Compose Compiler Metrics. Identifying the Root Causes of Excessive Recompositions
Stable data types
Issue. To understand why a method can be recomposed multiple times, we need to learn the concept of stability.
Stability allows the compiler to be sure that the type either does not change or notifies the composition when a change occurs. The compiler does not check whether a composable method has changed, if all of its arguments are stable.
Thus, stable data types are such types that either produce immutable instances or notify the composition about their state changes. Besides stable and unstable data types, there is also the third type—immutable. This is a more strict type that ensures that the object does not change at all.
To put it more rigorously, a stable type must satisfy the following conditions:
- The result of equals will always return the same result for the same two instances.
- When a public field of the class changes, the composition will be notified.
- All public field types are stable.
For the third condition to be satisfied, there must be stable types that developers could use to create their own stable data types. Jetpack Compose Compiler considers the following types stable: primitive types, String, function types, enumerations.
To gain deeper insight into the recomposition and stable data type concepts, I recommend reading this article by Denis Golubev. It demonstrates the following example:
// All the class fields are immutable. This is a stable class.
class StableClass1(
   val immutableValue: Int
)

// Composition knows when the state changes thanks to MutableState.
// This is a stable class as well.
class StableClass2(
   val mutableState: MutableState<String>
)

// There are mutable fields. This is an unstable class.
class UnstableClass1(
   var immutableValue: String
)

// A field belongs to an unstable type. This is also an unstable class.
class UnstableClass2(
   val unstableTypeField: UnstableClass1
)
Developers can also mark classes with the @Stable and @Immutable annotations.
Solution. To identify stable and unstable types, as well as skippable and restartable methods, which we detected with Recomposition Counts, we can use the Compose Compiler Metrics tool.
To get stats for the project, we need to add a task into app/build.gradle.kts and run the release build with the respective compiler flag enabled, as described in the article.
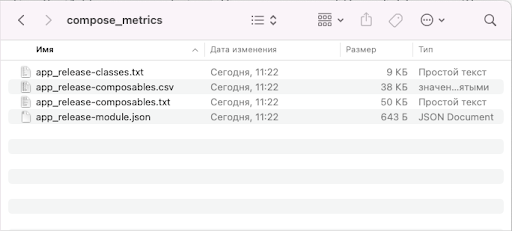
As a result, we will see four files in the build/compose_metrics folder that contain the following.
File #1. app_release-classes.txt contains information on class stability:
unstable class MigrationScreen {
 unstable val navController: NavController
 <runtime stability> = Unstable
}
stable class ExpandedStateStrings {
 stable val expandString: String
 stable val collapseString: String
 <runtime stability> = Stable
}
File #2. app_release-composables.txt contains information on whether methods are recomposable or skippable:
restartable skippable scheme("[androidx.compose.ui.UiComposable]") fun TopAppBarTitle(
 stable modifier: Modifier? = @static Companion
 stable name: String
 stable date: String
 stable weekName: String?
 stable menuExpanded: MutableState<Boolean>
)
File #3. app_release-composables.csv contains the same details but presented as a table.
File #4. app_release-module.json contains general information on the project:
{
"skippableComposables": 693,
"restartableComposables": 838,
"readonlyComposables": 0,
"totalComposables": 882,
...
}
Application. Let’s get back to Campus: we were interested in the ScheduleDayPage method. To find the information on it, we will check the app_release-composables.txt file:
restartable scheme("[androidx.compose.ui.UiComposable]") fun ScheduleDayPage(
unstable state: RemoteState<ScheduleDay>
stable onItemClick: Function1<ScheduleDetails, Unit>
stable viewAds: Function1<Lesson, Unit>
stable clickOnAds: Function1<Lesson, Unit>
)
As we can see, the method is not skippable and will be recomposed whenever applicable. We can also note that state is not a stable argument.
To fix this, we can annotate RemoteState and ScheduleDay classes as @Immutable after ensuring that these classes will not change after they are constructed.
Do not “slap” this annotation on classes with var fields or fields that contain lists.
This will resolve the issue of class instability, but we are not done with the method just yet. The metric has it marked as skippable, but in Layout Inspector we can still see excessive recompositions.
Unstable lists
Issue. There is a way to override class stability with annotations, but it does not solve the stability issues with lists, sets, and maps.
Solution. Chris Ward offers a solution to this problem that uses the kotlinx-collections-immutable library, which allows you to specify that a composable method should take an immutable list as an argument.
@Composable
fun StableGrid(
   values: ImmutableList<GridItem>
) {
   ...
}
Unstable lambdas
Issue. Our ScheduleDayPage class has function arguments as well, which you should be careful with in Compose.
Let’s check out the method initialization part:
@Composable
internal fun ScheduleScreenContent(
   selectedDate: LocalDate,
   onDateSelected: (LocalDate) -> Unit,
   onItemClick: (ScheduleDetails) -> Unit,
   viewAds: (LocalDate, ScheduleDay.Lesson) -> Unit,
   clickOnAds: (LocalDate, ScheduleDay.Lesson) -> Unit,
   scheduleDayForDate: (LocalDate) -> StateFlow<RemoteState<ScheduleDay>>
) {
   CalendarDayPager(
       selectedDate = selectedDate,
       onDateSelected = onDateSelected,
       dayContent = { date ->
           val scheduleDayFlow: StateFlow<RemoteState<ScheduleDay>> = remember(date) {
               scheduleDayForDate(date)
           }
           val scheduleDay: RemoteState<ScheduleDay> by scheduleDayFlow.collectAsState()
           ScheduleDayPage(
               state = scheduleDay,
               onItemClick = onItemClick,
               viewAds = { lesson -> viewAds(date, lesson) },
               clickOnAds = { lesson -> clickOnAds(date, lesson) }
           )
       }
   )
}
Take a look at how we pass functions to our ScheduleDayPage method.
Compose has a concept of unstable lambdas, which has been described in great detail by Justin Breitfeller.
One of the highlights of his article is how the compiler processes lambdas; namely, it creates an anonymous class with an invoke() method to put lambda content in it. In other words, every time we pass a lambda, we create an object of the anonymous class, which does not have a hash that would allow the compiler to compare it at the recomposition stage. So, the compiler thinks that the graph node state has changed and a recomposition is required.
Thus, Compose Compiler Metrics does not mark lambdas as unstable, yet recomposition still takes place.
In addition to passed arguments, lambdas may have external arguments (e.g., context), which might result in differences between the classes generated by the compiler.
Solution. The same article presents four ways to deal with this issue.
1. Method references. By using method references instead of lambdas, we can prevent a new class from being generated. Method references are stable function types and will remain equivalent between recompositions.
// Instead of a lambda...
{ lesson ->
   viewModel.playHooky(lesson)
}
// use a method reference
viewmodel::playHooky
2. Remember. Another option is to remember the lambda instance between recompositions. This will ensure the exact same instance of the lambda will be reused upon further compositions.
// Create a remembered object and pass it on initialization
val playHookyRemember: (Lesson) -> Unit = remember { { viewModel.playHooky(it) } }
Android documentation recommends making use of remember.
3. Static functions. If a lambda is simply calling a top-level function, the compiler considers it stable, since top-level functions do not take external arguments like context.
4. @Stable type in a lambda. As long as a lambda is only capturing other stable types it will not be updated by the compiler on graph recomposition.
var skippedLessons by remember { mutableStateOf(listOf("Biology", "Geography", "Chemistry")) }
Schedule(
   playHooky = { lesson ->
       skippedLessons += lesson
   }
)
Application. Going back to Campus, let’s use this new knowledge to fix incorrect lambda passes like so:
@Composable
internal fun ScheduleScreenContent(
   selectedDate: ComposeDate,
   onDateSelected: (LocalDate) -> Unit,
   onItemClick: (ScheduleDetails) -> Unit,
   viewAds: (LocalDate, ScheduleDay.Lesson) -> Unit,
   clickOnAds: (LocalDate, ScheduleDay.Lesson) -> Unit,
   scheduleDayForDate: (LocalDate) -> StateFlow<RemoteState<ScheduleDay>>
) {
   CalendarDayPager(
       selectedDate = selectedDate,
       onDateSelected = onDateSelected,
       dayContent = { date ->
           val scheduleDayFlow: StateFlow<RemoteState<ScheduleDay>> = remember(date) {
               scheduleDayForDate(date.toLocalDate())
           }
           val scheduleDay: RemoteState<ScheduleDay> by scheduleDayFlow.collectAsState()

           // Lambda is moved to a separate object with ‘remember’
           val viewAdsRemember: (ScheduleDay.Lesson) -> Unit =
               remember(date) { { lesson -> viewAds(date.toLocalDate(), lesson) } }

           // Lambda is moved to a separate object with ‘remember’
           val clickOnAdsRemember: (ScheduleDay.Lesson) -> Unit =
               remember(date) { { lesson -> clickOnAds(date.toLocalDate(), lesson) } }

           ScheduleDayPage(
               state = scheduleDay,
               onItemClick = onItemClick,
               viewAds = viewAdsRemember,
               clickOnAds = clickOnAdsRemember
           )
       }
   )
}
CPU Profiling. Finding "Hot" Methods and Freeing up the CPU
CPU Profiler
CPU profiling has to be the most powerful tool against app hanging. On top of that, optimizing CPU usage of your app has many other benefits, such as faster and smoother user experience and improving battery life of the device.
You can use the profiler to inspect CPU usage of your app and thread activity during interaction with the app.
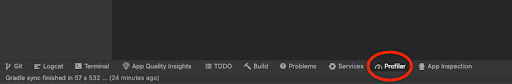
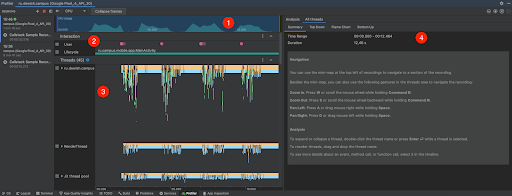
Application. This article by Takeshi Hagikura is a good guide on getting the CPU profiler up and running. Let's figure out what these stats are good for using Campus as an example. Run the project in the emulator and go to the Profiler tab.
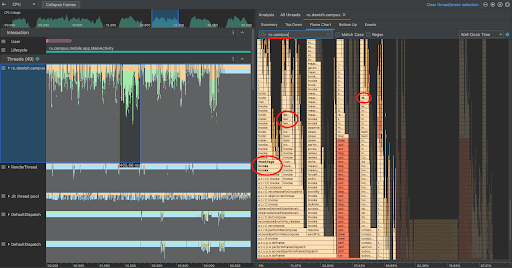
Once the app is initialized, the CPU, Memory, and Energy graphs will be displayed. We will focus on CPU stats. In its detailed view you should see the following:
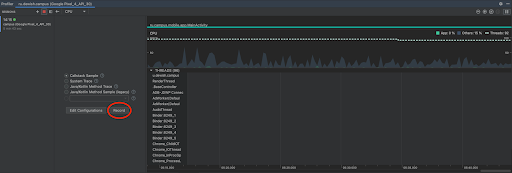
To record the stats, click Record, interact with the app for a while, and click Stop.
After the record is created, you should see the following screen showing CPU usage over the recorded interval (1), app interaction stats (2), threads (3), and detailed thread analysis (4).
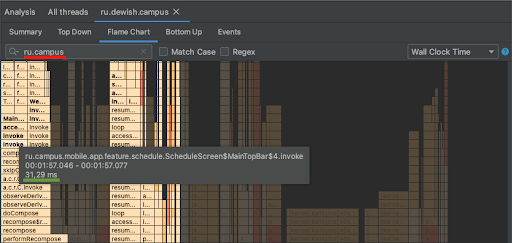
Flame Chart
Next, we will focus on the Flame Chart tab, which contains a chart of function calls with associated CPU usage time. This chart helps with identifying the processes that run longer than expected, which we can optimize.
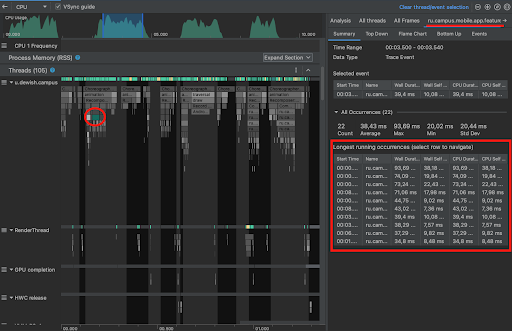
First, in the CPU Usage window, we select the interval that we are interested in. Then we can pinpoint it in the Threads window. Let's select the most prominent bars.
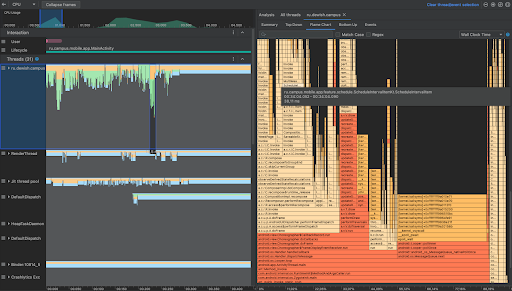
Here are the values we should focus on:
1. Component draw time. The standard refresh rate for the majority of smartphone screens is 60 Hz. That means that the displayed image is fully updated 60 times a second or every 16.67 milliseconds.
So, for the UI to be smooth, this should be the maximum time for drawing a component. Thus, pay attention to the “hottest” methods.
To calculate the drawing time, consider the proportion of values in Flame Chart to the number of seconds in the selected interval. The exact interval duration can be found in the Summary tab.
2. CPU usage. Try to keep the CPU idle most of the time, let it stay “cool”.
3. Components we can influence. You can select those using the search bar. For instance, if you search for the project name, the profiler will highlight parts of the “flame” with your methods in color and the text in method bars in bold.
4. Methods we can move to another thread. Some intensive tasks can be separated into another thread. For instance, that could be interactions with databases.
Read this article for more details on CPU profiler capabilities.
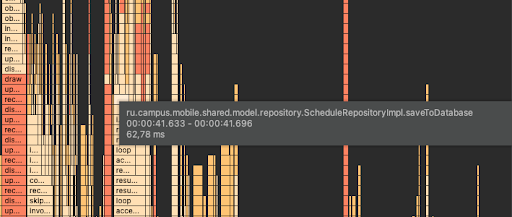
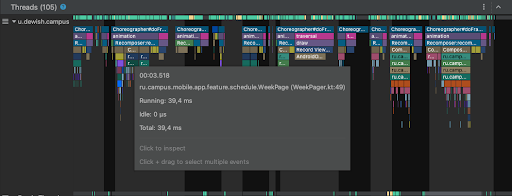
Application. Now let’s go back to Campus. In our case we have swipes over the schedule screen that we would like to optimize. Let’s pick one of these in the CPU Usage window and select the main thread in the Threads window. Then we can search for our project: this highlights three methods that take up a lot of CPU time.
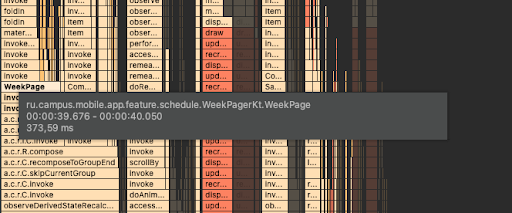
We are going to examine just one of them. The WeekPage method takes up a whopping 400 milliseconds in the 4 seconds interval. To calculate it more precisely, we should average over several values. Take note of the approximate value for CPU time used on this method: 95 milliseconds.
@Composable
fun WeekPage(
startOfWeek: LocalDate,
selectedDate: LocalDate,
currentDate: LocalDate,
onDateSelected: (LocalDate) -> Unit
) {
Row(
modifier = Modifier
.fillMaxWidth()
.padding(horizontal = 16.dp),
horizontalArrangement = Arrangement.SpaceBetween
) {
DayOfWeek.values().forEach { dayOfWeek ->
val date: LocalDate = startOfWeek.plus(DatePeriod(days = dayOfWeek.ordinal))
val simpleDateFormat = SimpleDateFormat("EE", Locale.getDefault())
val dayOfWeekName = simpleDateFormat.format(date.toJavaDate()).uppercase()
val shape = RoundedCornerShape(8.dp)
Box(...) { ... }
}
}
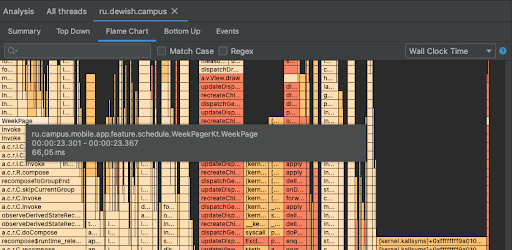
}Looking at our code, we can see an obvious flaw: SimpleDateFormat is initialized in the loop body for each Row. We can fix this by moving the initialization away from Row and by using remember.
After the fix, let’s check the results. By doing this, we reduced the time it takes to drawWeekPage to 60–70 milliseconds (the image shows an interval of about 1 second):
System Trace
You can also get CPU usage stats focused on composable methods only. To do so, use the Jetpack Compose Composition Tracing tool.
Jetpack Compose Composition Tracing is available starting with the following versions:
- Android Studio Flamingo Canary 1;
- Compose UI 1.3.0-beta01;
- Compose Compiler 1.3.0.
Compose Composition Tracing can display composable functions of Jetpack Compose in System Trace Android Studio Flamingo. Follow the instructions in the article by Ben Trengrove and install the appropriate version of Android Studio, then add the dependency into app/gradle.kts.
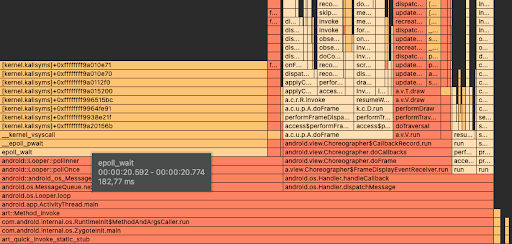
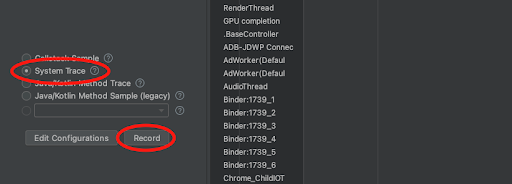
Application. Select the System Trace configuration in CPU profiler, click Record, interact with the app for a while, and click Stop.
After the record is created, you should see the following screen:
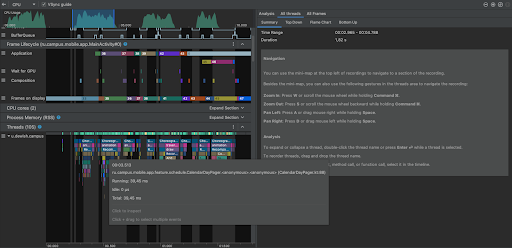
When checking the system trace, you can view trace events in the thread timeline to see the details on the events occurring in every thread. We have several new tabs: Display (1), Frame Lifecycle (2), CPU Cores (3), and Process Memory (4). The Threads tab looks a bit different and displays a chart of composable function calls now.
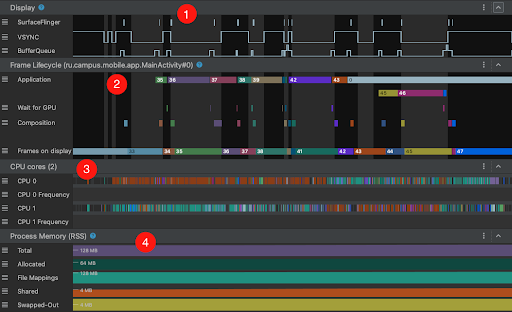
These tabs show activity for each core, the size of physical memory that the app uses currently, and more. The Threads tab displays a call chart, while the detailed thread stats also show Flame Chart, where only composable method stats are shown.
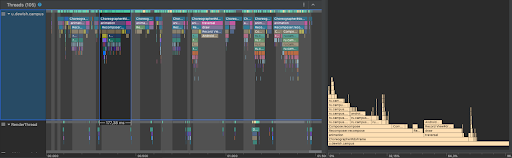
In Threads, you can click a method to search for it across the entire recorded interval and see how many times the thread was called and the average time spent for each call.
Read <a href="https://developer.android.com/studio/profile/inspect-traces" target="blank">the official documentation for more details on System Trace capabilities._
GPU Profiling. Learning Which Components Take a Long Time to Draw
Another important profiling tool is the GPU profiler.
The documentation states that the Profile GPU Rendering tool displays a scrolling bar chart showing the time it takes to render frames of the user interface against the reference value of 16.67 milliseconds per frame.
To use this profiler, you will need a device running Android 4.1 (API level 16) or later. A guide on enabling it is available in the documentation.
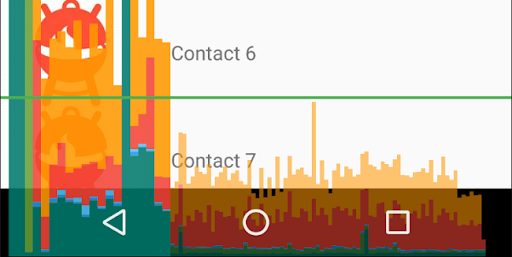
The green horizontal line represents the value of 16.67 milliseconds. To reach 60 frames per second, the vertical bar for each frame has to remain below this line. Every time a bar goes above this line, the animation may stutter.
The documentation describes bar color coding.
Application. Using Campus as an example we can take note of prominent blue, light green, and dark green bars.
This shows us that creating and updating lists (blue bars) takes long, which could be because we have many custom views or onDraw methods do some intensive work. Processing onLayout and onMeasure methods (light green bars) takes a long time as well, which might indicate that a complex view hierarchy is drawn. On top of that, a lot of time is spent on animators performed for the views and on handling input callbacks (dark green); view bindings during scrolling, such as RecyclerView.Adapter.onBindViewHolder(), also typically occur during this segment and are the most common source of slowdowns in it.
The next image shows a chart of the app after various optimizations described above.
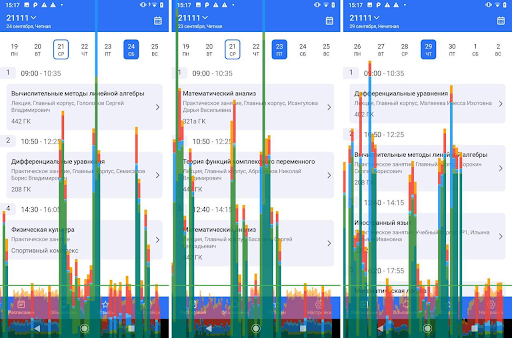
The results show that there is still room for optimization.
More Tips on Fixing Bugs Identified with Profiling Tools
I gathered a few tips from the official documentation and this article by Mukesh Solanki.
1. Always use remember in composable methods. Recomposition can occur at any time for a number of reasons. If you have a value that is supposed to survive a recomposition, remember will help you keep it that way.
2. Use lazy layouts only when necessary. Using LazyRow for a list of five items can slow rendering down significantly.
3. If at all possible, refrain from using ConstraintLayout. Use Column and Row instead. ConstraintLayout is a system of linear equations, which requires more computations than generating elements one after another.
If you found this article useful, subscribe to our Telegram channel to never miss our new publications.